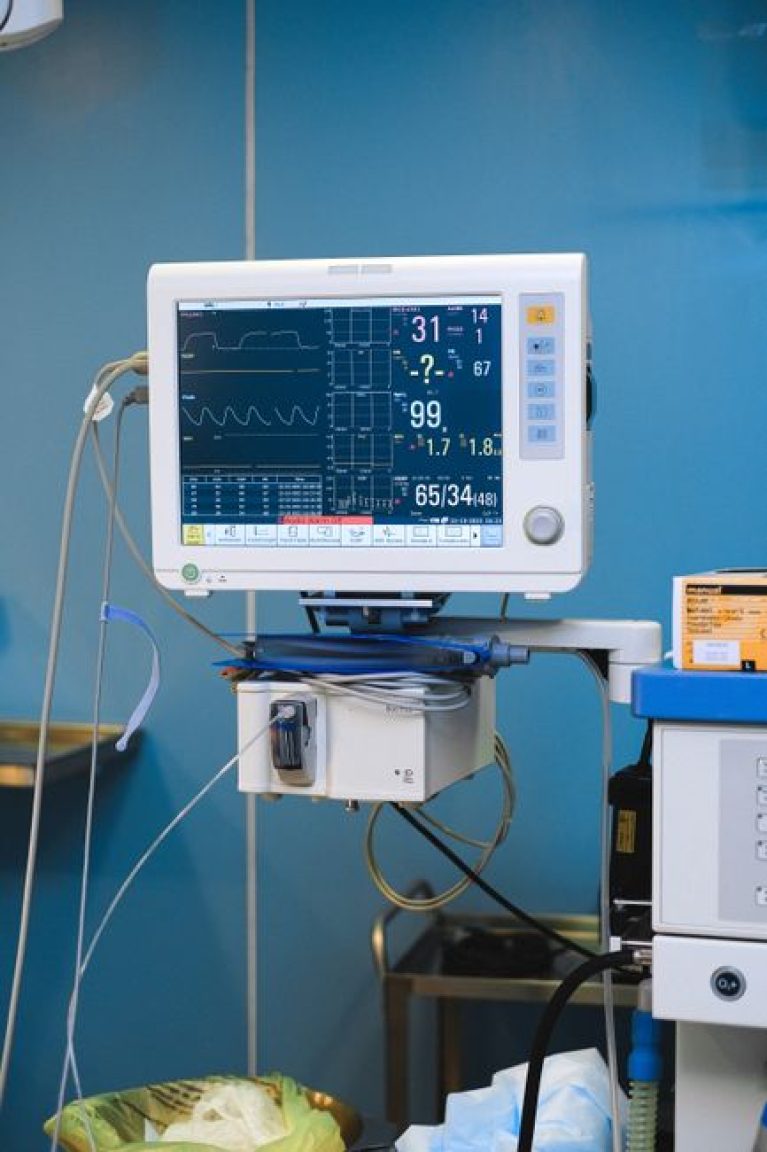
A low SpO2 reading can trigger emergency action—rightly or wrongly.
Picture a clinician seeing an SpO2 of 88% on a patient with darker skin: the immediate choices—start high‑flow oxygen, admit to intensive care, intubate—carry real risk. Pulse oximeters have been shown to overestimate oxygen saturation in people with darker pigmentation, so a worrying number can be falsely reassuring, and a borderline low number can prompt unnecessary invasive care.
When a reading changes management, confirm before acting. Check waveform quality and perfusion index, reposition or change the probe, try a different site or device, and correlate with respiratory rate, work of breathing and pulse. If the reading remains discordant with the clinical picture or decisions are irreversible, obtain arterial blood gas or CO‑oximetry for definitive SaO2, document device and skin tone, and escalate treatment based on objective gas measurements plus clinical judgment.
How pulse oximeters read oxygen: the photoplethysmography principle
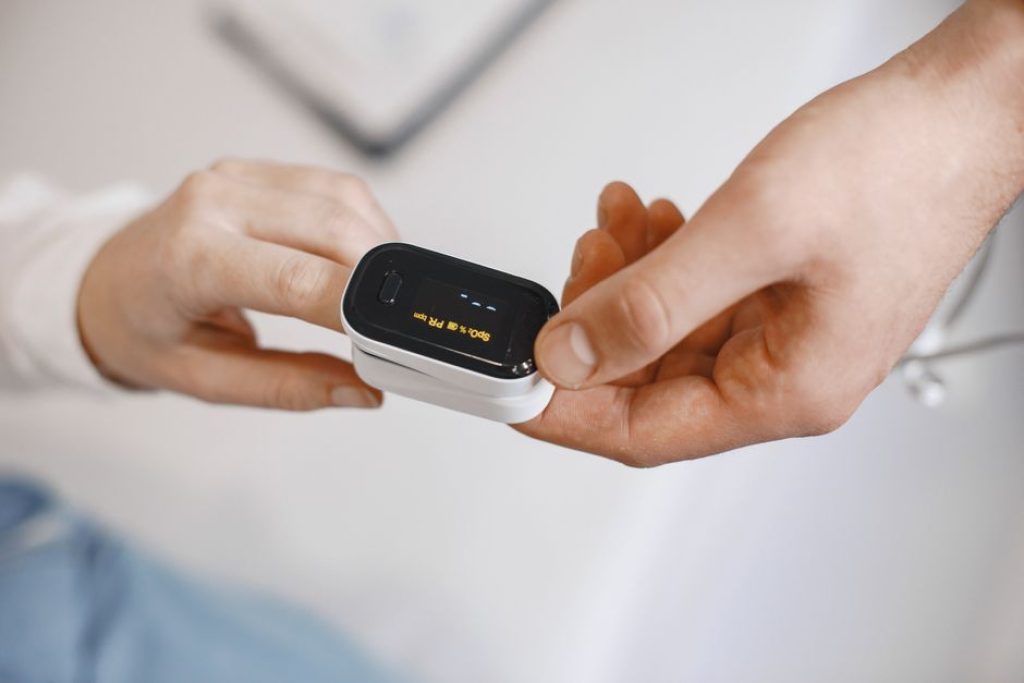
Pulse oximeters use photoplethysmography (PPG): two LEDs (red ~660 nm and infrared ~940 nm) shine light into skin, and a photodetector measures how much light emerges. The device separates a steady background signal (DC) from the tiny pulsatile component (AC) produced by arterial blood volume changes with each heartbeat.
The key computation is the AC/DC ratio for each wavelength; the ratio of red to infrared pulsations is converted to SpO2 using a calibration curve derived from volunteer studies. Because the method depends on relative pulsatile absorption, any factor that changes either the AC or DC terms can shift the computed ratio and thus SpO2.
Where bias can be introduced
- Emission and transmission: melanin absorbs visible light, increasing the DC baseline—this changes the AC/DC proportion for red light relative to infrared.
- Detection and signal processing: sensor gain, filtering, and motion-artifact rejection can amplify or suppress pulsatile signals unevenly across skin tones.
- Calibration: many devices are calibrated on limited skin-tone samples, so the mapping from ratio to SpO2 may be systematically off.
These mechanisms explain how skin pigmentation, low perfusion, and signal handling can produce systematic measurement errors.
Biophysical pathways that alter SpO2 estimates
How melanin and tissue optics change the PPG signal
Three physical effects explain why skin pigmentation can shift SpO2 readings: absorption by melanin, light scattering in tissue, and a change in the pulsatile (AC) component that pulse oximeters rely on.
- Melanin absorption. Melanin absorbs light across the visible and near‑infrared spectrum, with stronger absorption at shorter (red) wavelengths. That raises the steady (DC) light attenuation under the probe, altering the measured red/infrared ratio used to estimate oxygenation.
- Scattering. Photon paths in skin and underlying tissue are lengthened and randomized by scattering. Increased pathlength amplifies the effect of absorbers (including melanin and blood) and can change the relative sizes of AC and DC signals regardless of true arterial oxygen content.
- Reduced pulsatile fraction. Because melanin chiefly affects the nonpulsatile background, the AC/DC ratio (the core PPG metric) can shrink on darker skin. A smaller pulsatile fraction increases sensitivity to noise and calibration errors, producing systematic SpO2 bias (commonly overestimation in some devices).
Device factors and context modulate these pathways: wavelength choice, sensor geometry, calibration datasets, ambient light, low perfusion, motion, and nail coverings all change how absorption/scattering translate into SpO2 error. Engineering choices and clinical context therefore determine real‑world bias, not pigmentation alone.
Device wavelength, sensor fit, and calibration population can reduce or amplify pigmentation effects. Clinical conditions (poor perfusion, motion, ambient light) further modify error risk.
Transparent methods note: inclusion criteria and metrics
Only human studies directly comparing pulse oximeter SpO2 to arterial oxygen saturation (SaO2) by laboratory co-oximetry were included; contemporaneous sampling and reportable numerical outcomes were required.
-
Study selection
Paired SpO2–SaO2 data from human subjects of any age or care setting were eligible if arterial sampling was time‑matched (typically minutes). Studies had to report race/ethnicity or a quantified skin‑pigmentation measure; isolated case reports without systematic data were excluded.
-
Key metrics extracted
Primary outcomes: mean bias (SpO2–SaO2), accuracy root‑mean‑square (ARMS), limits of agreement, and sensitivity/specificity for hypoxemia thresholds, with confidence intervals. Repeated‑measures methods were noted and used where provided.
-
Devices and confounder handling
Included clinical and consumer fingertip oximeters, hospital monitors, and smartphone systems. Extracted adjustments/stratifications for skin pigmentation (Fitzpatrick or spectrophotometry), hemoglobin, perfusion index, nail polish, motion, and ambient light when available.
What the studies actually found
What the numbers show
Across multiple hospital and laboratory comparisons of pulse oximeter SpO2 versus arterial SaO2, the average systematic error is real but modest. Typical mean biases cluster in the range of about +0.5 to +3 percentage points (SpO2 higher than SaO2), with most high-quality series reporting ~1–2% overestimation on average. Root‑mean‑square errors and limits of agreement are larger, however, indicating substantial variability around that mean.
A consistent and more clinically relevant finding is an increased rate of occult hypoxemia (SaO2 below a treatment threshold despite apparently acceptable SpO2). One large hospital study reported occult hypoxemia rates of roughly 11.7% vs 3.6% when comparing darker‑skinned and lighter‑skinned groups at common clinical thresholds. Smaller studies and meta‑analyses show the same direction of effect, though absolute differences vary.
Practical size and clinical meaning
- A mean SpO2 overestimate of 1–2% can move a patient across common decision thresholds (for example, from 91% to 92–93%), potentially delaying oxygen or escalation.
- The risk concentrates near lower saturations; above about 95% average bias is smaller and less likely to change decisions.
Main limitations and uncertainty
- Device coverage: Few studies test the full spectrum of commercial pulse oximeters; many consumer models are unstudied. Results are device‑dependent.
- Low‑saturation data scarcity: Observations when SaO2 < 85% are relatively rare, inflating uncertainty where clinical consequences are greatest.
- Heterogeneous skin classification and confounders (perfusion, motion, anemia) complicate pooled estimates.
Overall: the average bias is modest but clinically meaningful at decision thresholds; uncertainty remains large for specific devices and low SaO2 ranges.
Do not rely on a single SpO2 reading near treatment thresholds. Confirm low or borderline SpO2 with arterial oxygen measurement before irreversible interventions; consider repeated readings, clinical signs, and device variability.
Clinical consequences of a 1–3% SpO2 bias
Small, systematic SpO2 overestimates matter because common treatment decisions use narrow numeric cutoffs. A 1–3% positive bias can move a patient from “below threshold” to “above threshold,” producing false reassurance and missed treatment.
What a few percentage points do in practice
- SpO2 92% threshold (common hospital oxygen trigger): a true SaO2 of 90% measured with +2% bias appears as 92% and may not prompt supplemental oxygen or escalation.
- SpO2 90% (widely used hypoxemia cutoff): a +1% bias masks some patients with true hypoxemia; a +3% bias hides many more.
- SpO2 88% (COPD target lower limit): a +2–3% overestimate can cause inappropriate withholding of bronchodilators, steroids, or controlled oxygen adjustments.
Mechanism: the bias systematically shifts the distribution of measured SpO2 upward, increasing false negatives (occult hypoxemia). When a patient population clusters near a threshold, even a 1–2% bias can reduce sensitivity substantially and change the balance between harms (missed hypoxemia) and benefits (avoiding unnecessary oxygen).
Best practices: treat readings close to action thresholds with caution, inspect the pleth waveform and site quality, repeat measurement on another site or device, and confirm with arterial co‑oximetry when the result would change irreversible or high‑risk care.
Even a 1–2% overestimate can hide clinically important hypoxemia. For SpO2 values within a few points of treatment cutoffs, rely on waveform quality, repeat checks, alternate sites, or arterial co‑oximetry before withholding therapy.
Selection and evaluation checklist
Stepwise protocol for a reliable SpO2 reading
-
Prepare the patient
Warm the extremity, remove nail polish or artificial nails, and allow the patient to rest 1–2 minutes. Minimize motion and stray light over the sensor.
-
Choose site and sensor
Use the same finger each time; if peripheral perfusion is poor, try forehead or earlobe placement. Confirm the probe fits snugly and the device shows a clear pulse.
-
Acquire and verify
Place the sensor and wait 30–60 seconds for a stable plethysmographic waveform; record at least three readings over 1–2 minutes. Check pulse rate and perfusion index as quality indicators.
-
Follow trends and clinical context
Prioritize direction and persistence over single numbers and correlate with respiratory rate, work of breathing, consciousness, and skin color. See why oximeter readings can fluctuate for more on short‑term variability.
-
Escalate to confirmatory testing
Obtain arterial blood gas or co‑oximetry and consult clinical care when SpO2 is <90%, falls >3% without explanation, conflicts with clinical signs, or signal quality is poor.
Confirm with ABG or co‑oximetry when any of the following occur:
Persistent hypoxemia (SpO2 <90%) Significant unexplained desaturation (>3%) Clinical instability: hypotension, altered mental status, or high work of breathing Suspected carbon monoxide or methemoglobinemia, severe anemia, or poor perfusion Before major interventions (intubation, high‑flow oxygen) if accuracy mattersRemember: trends and bedside clinical signs matter more than an isolated SpO2 value.
Regulatory and manufacturer responsibilities
Regulators set expectations: medical‑grade pulse oximeters are expected to demonstrate accuracy across a range of skin pigmentation and, crucially, at low arterial oxygen levels. Manufacturers must validate devices on diverse populations, report low‑saturation performance and disclose known limitations.
Current evidence has limits: many studies lack adequate numbers of people with dark skin at low SaO2, skin‑tone labels are inconsistent, and commercial devices use different wavelengths and calibration methods. Those gaps mean device behavior cannot be fully predicted for all users or situations.
Practical checklist
- Trust readings when: SpO2 ≥ 96%, a clear pulsatile waveform is present, perfusion is good, and values are stable over minutes. Trends are more informative than single values.
- Confirm when: SpO2 90–95%, sudden drops, poor perfusion, or clinical signs of hypoxia — especially for darker skin tones.
- Immediate steps for borderline values (<95% or suspicious readings): recheck on the same finger, warm and reposition the digit, try a different finger or earlobe, repeat after one minute, and assess respiratory signs. If low values persist or clinical concern exists, obtain arterial blood gas or escalate care.
When SpO2 contradicts visible respiratory distress: assume the patient may be hypoxic until proven otherwise. Recheck with a different site or device, monitor continuous trends, and prioritize arterial co‑oximetry for definitive oxygenation before making irreversible treatment decisions.
Key points and next steps
- Regulators require diverse validation but study gaps remain, especially at low SaO2.
- Manufacturers should report low‑saturation accuracy and calibration details; clinicians must consider device limits.
- Use thresholds and simple recheck steps to decide when to trust or confirm readings.
Pulse oximeter readings can be useful but are not infallible, particularly for low oxygen levels and darker skin. Favor trends, verify borderline values with repeat checks or alternate sites, and obtain arterial measurements when treatment decisions depend on precise oxygenation.